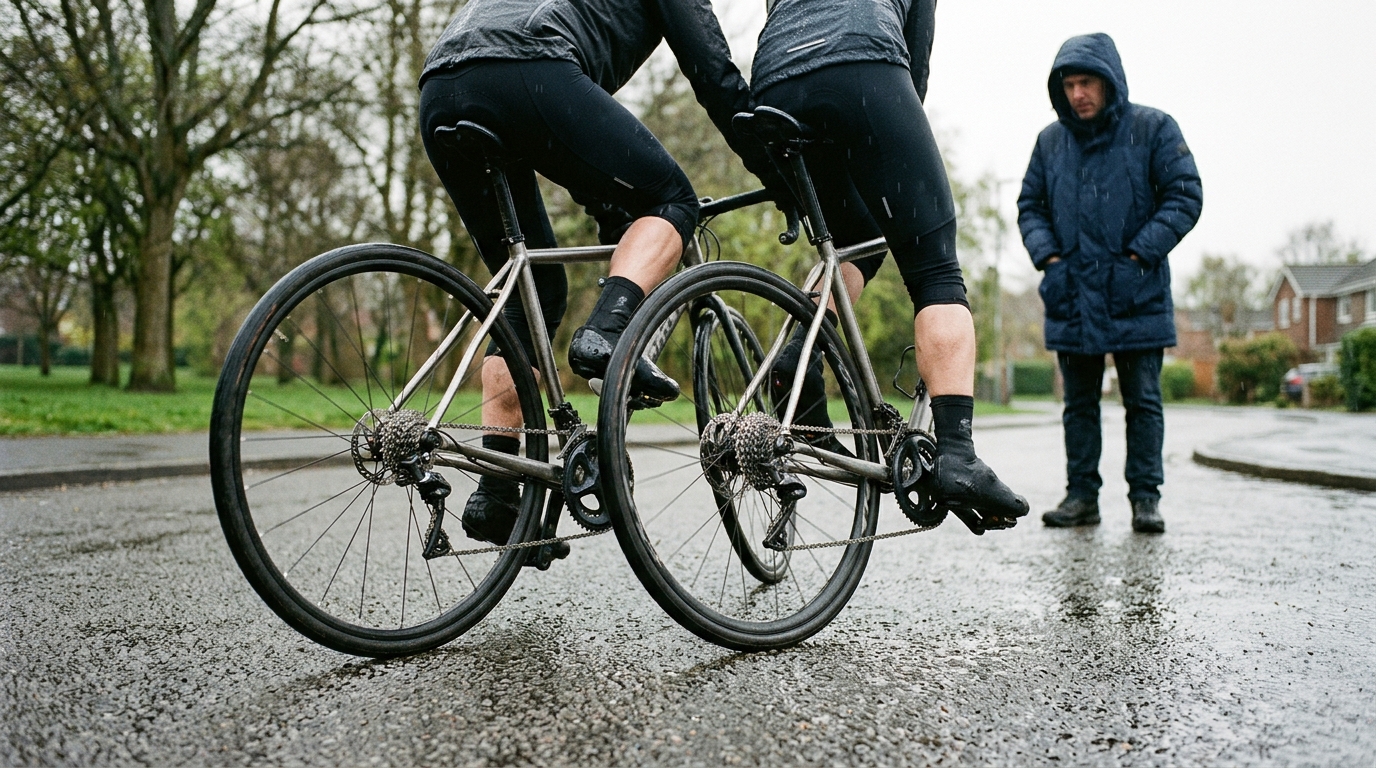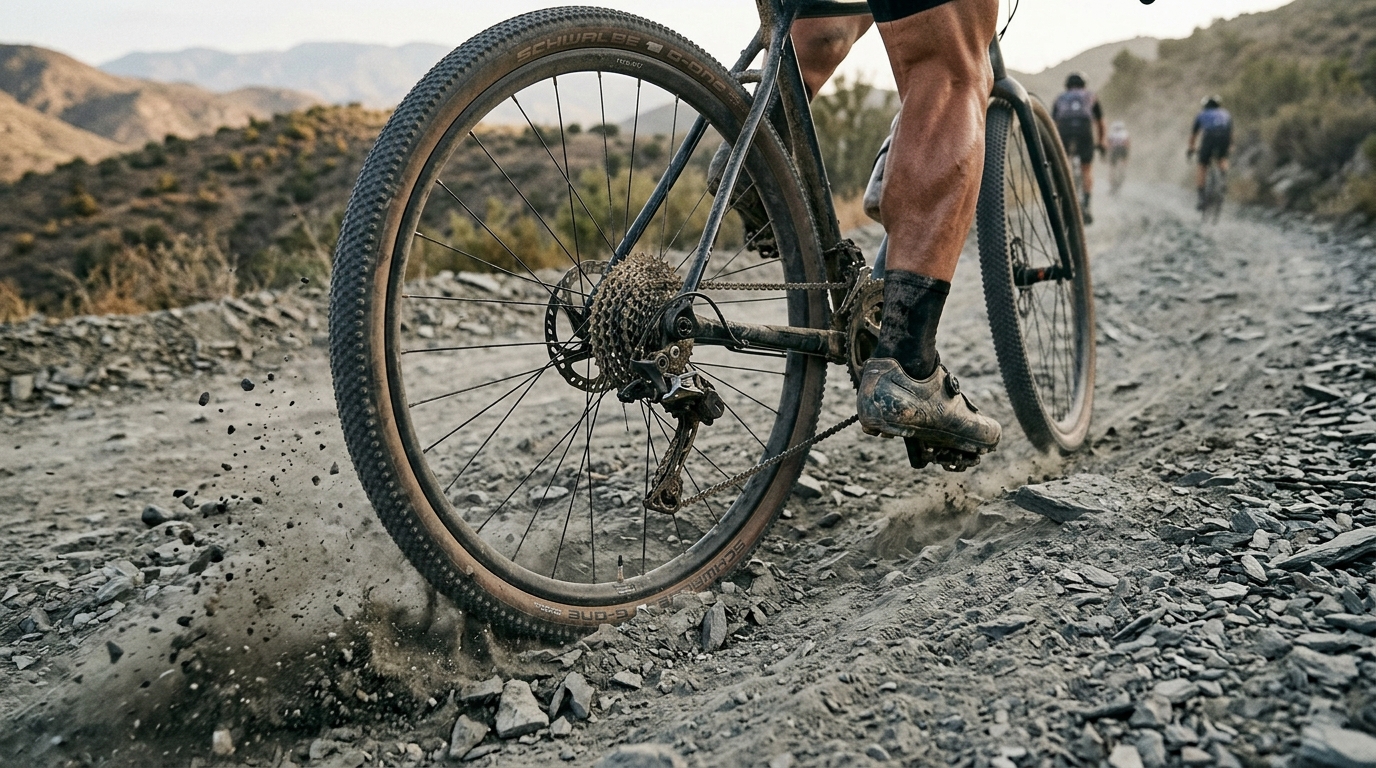
Imagen generada por nuestro modelo.
gravel
Gravel Cycling Power: How to Read Effort Beyond Speed
Learn how to analyze gravel cycling power, review mixed terrain ride files, and build repeatable benchmarks for smarter pacing.
Why Speed Breaks Down on Gravel
Speed is a useful race outcome, but it is a weak fitness signal on mixed terrain. Surface quality, line choice, tire pressure, traction, wind exposure, gearing, and micro-terrain all change how much speed you get for the same effort.
That is why gravel cycling power is usually the better starting point for analysis. A rider can produce a controlled, costly effort through washboard, sand, or a loose climb and still look slow in the file. Another rider can carry speed across a firm, sheltered sector without doing the same work.
The conclusion is simple: treat speed as the result, not the explanation. If the goal is to understand pacing, fueling, setup, or fatigue, the real answer comes from power, heart rate, cadence, perceived effort, and notes about the terrain.
The Metrics That Actually Explain a Gravel Ride
A useful gravel ride review does not need every metric on the dashboard. It needs the few signals that explain where the cost came from.
Average power
Average power shows total mechanical output across a ride or segment. It is still valuable on steady climbs, long road transitions, and repeatable benchmark sections.
On variable gravel, it can understate the cost of the ride. Coasting into loose corners, soft-pedaling through rough sections, and punching out of slow turns all pull the average down, even when the repeated accelerations are doing real damage.
Use average power to answer: 'How much work did I produce across this section?' Do not use it alone to decide whether the ride was well paced.
Normalized power
Normalized power is useful because it better reflects the cost of uneven riding. Two gravel rides can finish with similar average power, while one feels far harder because it contains repeated accelerations, traction losses, and short climbs that force surges.
Use normalized power to answer: 'Did the variability of this ride make it more costly than the average power suggests?'
This matters most when the decisive efforts are too short to dominate the average but frequent enough to accumulate fatigue.
Variability index
Variability index compares normalized power with average power. A tighter relationship points toward steadier output. A wider gap points toward more surging, coasting, technical interruptions, or terrain-driven changes in pressure.
The key is interpretation. A high variability index on a rough, punchy course can be an acceptable terrain cost if the surges preserved momentum, protected traction, and did not compromise the finish. The same pattern on a smooth route is usually a pacing failure, a positioning problem, or a sign that the group kept dragging you into unnecessary accelerations.
Use variability index to answer: 'Was the ride stochastic because the terrain demanded it, or because I rode it poorly?'
Power duration curve
The power duration curve shows where the ride made its hardest demands. Gravel often decides riders through repetition rather than one obvious maximal effort: short spikes on loose pitches, accelerations out of corners, and long firm sectors ridden under pressure.
Use the curve to answer: 'Which durations did this ride keep asking for, and were those efforts placed at moments I could afford?'
If the file repeatedly pulls you above sustainable intensity early, the issue may not be general fitness. It may be pacing discipline, gearing, tire choice, or positioning. For athletes using threshold anchors, keep your FTP current enough that zone-based comparisons still mean something.
How to Read Power Spikes on Loose Climbs
Power spikes on gravel climbs are not automatically mistakes. Loose climbs change the pacing problem. Sometimes a short increase in torque is the cleanest way to hold traction, clear a rut, or keep momentum over a rough patch.
The mistake is treating every spike as productive.
A good spike has a job. It prevents a stall, protects position, or gets you through terrain where losing momentum would cost more than the surge itself. A bad spike is reactive. It happens because you entered the climb in the wrong gear, followed another rider's rhythm, stood at the wrong moment, or let cadence collapse until the only option was brute force.
When reviewing the file, look at the sequence rather than the peak value:
- Did cadence drop before the spike?
- Did the spike preserve momentum or prevent a dismount?
- Did heart rate keep rising after the surge?
- Did the same pattern repeat on similar terrain?
- Did the spike force soft-pedaling or a loss of contact later?
If spikes are followed by controlled riding, they may be part of good gravel execution. If they are followed by extended recovery, repeated cadence drops, or rising perceived effort, they are costing more than they return.
The practical fix is usually not heroic. Choose a gear that lets you keep pressure on the pedals without grinding, stay seated when traction is fragile, and surge only when the terrain demands it. Gravel rewards controlled aggression, not constant aggression.
A Repeatable Post-Ride Workflow
A data-driven gravel review should follow the same sequence after key rides. That consistency is what turns a messy file into a useful pattern.
1. Segment the file by terrain
Do not review the ride as one block. Split it into the sections that actually shaped the effort: steady climbs, loose climbs, rolling sectors, technical sectors, firm road transitions, and the final portion of the ride.
This prevents one fast or slow surface from distorting the whole analysis.
2. Compare average power and normalized power
For each key segment, compare average power with normalized power. If the gap is wide, ask whether the terrain required that variability.
A wide gap on a loose, punchy sector can be the price of keeping traction and momentum. A wide gap on a smooth sector is a red flag. That is usually where poor pacing, bad positioning, or unnecessary accelerations are hiding.
3. Check cadence before the spikes
Before judging a power spike, look at cadence leading into it. If cadence collapses first, the spike may be a gearing or traction problem rather than a deliberate tactical choice.
This is where gravel files often become clear. The rider thinks the climb required repeated maximal pressure, but the data shows the same pattern starting with low cadence and ending with a costly surge.
4. Compare heart rate drift against power
Look at whether heart rate rises while power stays similar or fades. If heart rate keeps climbing during steady or declining power, the ride is becoming more expensive internally.
That can point toward heat, dehydration, poor fueling, fatigue, rough surface resistance, or accumulated muscular strain. Power shows output. Heart rate shows how hard the body is working to produce it.
5. Add equipment and surface notes
Finish the review by adding the context the file cannot know:
- Tire model and pressure
- Surface description
- Weather and wind impression
- Gearing used on key climbs
- Traction issues
- Sections where cadence felt forced
- Fueling and hydration quality
- Mechanical or handling problems
These notes are not decoration. They explain why the numbers happened. Without them, you are comparing gravel rides as if the ground was neutral, which is the fastest way to draw the wrong conclusion.
A Simple Example Scenario
Consider a rider who finishes a mixed gravel ride with average power that looks similar to a previous strong ride, but fades late and reports a much harder perceived effort.
The headline number says fitness was similar. The segmented file tells a different story. Early loose climbs forced repeated surges. Cadence dropped before several of them. Normalized power sat noticeably above average power on those sectors. Heart rate never fully settled afterward, even when power became more controlled.
That is not a mystery fade. It is the cost of early stochastic riding showing up late. The rider may need better gearing, calmer traction management, different positioning before loose climbs, or more discipline in deciding which surges are worth paying for.
This is the point of gravel cycling power analysis: not to admire the file, but to find the decision that changed the ride.
Heart Rate, Power, and Perceived Effort Off-Road
Power responds immediately. Heart rate responds with a delay. Perceived effort captures the total experience: muscle load, breathing, heat, concentration, fueling, tension, and fatigue.
On gravel, all three matter.
Power is the best tool for controlling effort on climbs and steady sectors. It tells you when pressure is moving from sustainable to costly. But on rough ground, chasing a narrow power target can make riding worse. In those moments, power should act as a guardrail, not a command.
Heart rate is the strain check. If power is stable but heart rate trends higher than expected, the ride is becoming more expensive because of internal or environmental cost. Gravel often hides that because speed may already be low.
Perceived effort fills the gap the power meter cannot see. Technical riding creates cognitive and muscular load. A rough descent, loose cornering, or constant line selection can make a ride feel costly even when the power file looks modest.
Use the three signals together:
- Power high, heart rate controlled, effort manageable: likely strong output and good pacing
- Power high, heart rate high, effort high: useful if decisive and timed well, costly if early
- Power low, heart rate high, effort high: likely heat, fatigue, rough surface, poor fueling, or accumulated strain
- Power low, heart rate controlled, effort high: likely technical tension, muscle damage, or setup issues
A single metric rarely explains gravel. The job is to identify the source of the cost.
Build Benchmarks That Answer Specific Questions
Good benchmarks are not laboratory tests. They are repeatable sections that match the demands of the riding or racing you care about.
Choose segments based on the question each one answers:
- Steady climb with reliable traction: 'Is aerobic output improving under controlled conditions?'
- Loose climb: 'Can I manage torque, cadence, and traction without wasteful surges?'
- Rolling sector: 'Can I preserve momentum and control repeated accelerations?'
- Technical section: 'Can I stay smooth when handling matters more than raw power?'
- Long mixed loop: 'Does endurance durability hold when surfaces and demands keep changing?'
For each benchmark, track power, normalized power, heart rate response, perceived effort, cadence feel, tire pressure, and surface condition. The goal is to separate fitness changes from setup and execution changes.
If power improves on the steady climb at similar perceived effort, fitness is likely moving in the right direction. If power is unchanged but heart rate is more controlled and the ride feels easier, efficiency or durability may be improving. If loose-climb power is not higher but spikes are fewer and recovery is faster, execution is improving even if the headline number looks unchanged.
Benchmarks should also shape training choices. If loose climbs trigger repeated costly surges, add work that teaches controlled torque and short recoveries. If long mixed sections create heart rate drift despite conservative power, fueling and endurance durability need attention. If technical sectors feel expensive without high power, handling, tire setup, and upper-body relaxation may be the limiter.
For cleaner anchors, pair field benchmarks with periodic threshold checks using the FTP estimator. Then interpret outdoor gravel files against a threshold that is current enough to be useful.
The Bottom Line
Gravel cycling power is most useful when it is interpreted with terrain, setup, and pacing context. Speed tells you the outcome. The file tells you why it happened.
The best riders are not trying to make every gravel file look smooth. They are learning which spikes were necessary, which were wasteful, and how to repeat strong execution when the terrain refuses to be consistent.