Image generated by our model.
drafting
How to Measure Real Drafting Savings in Group Rides
Use power, speed, wind and position notes to estimate the real aerodynamic saving from sitting in during group rides, races and fast training sessions.
Why Drafting Makes Speed a Misleading Fitness Signal
Speed feels like the cleanest performance metric because it is visible, immediate and emotionally satisfying. The problem is that speed is heavily mediated by the air around you, and in a group ride, that air is rarely yours alone.
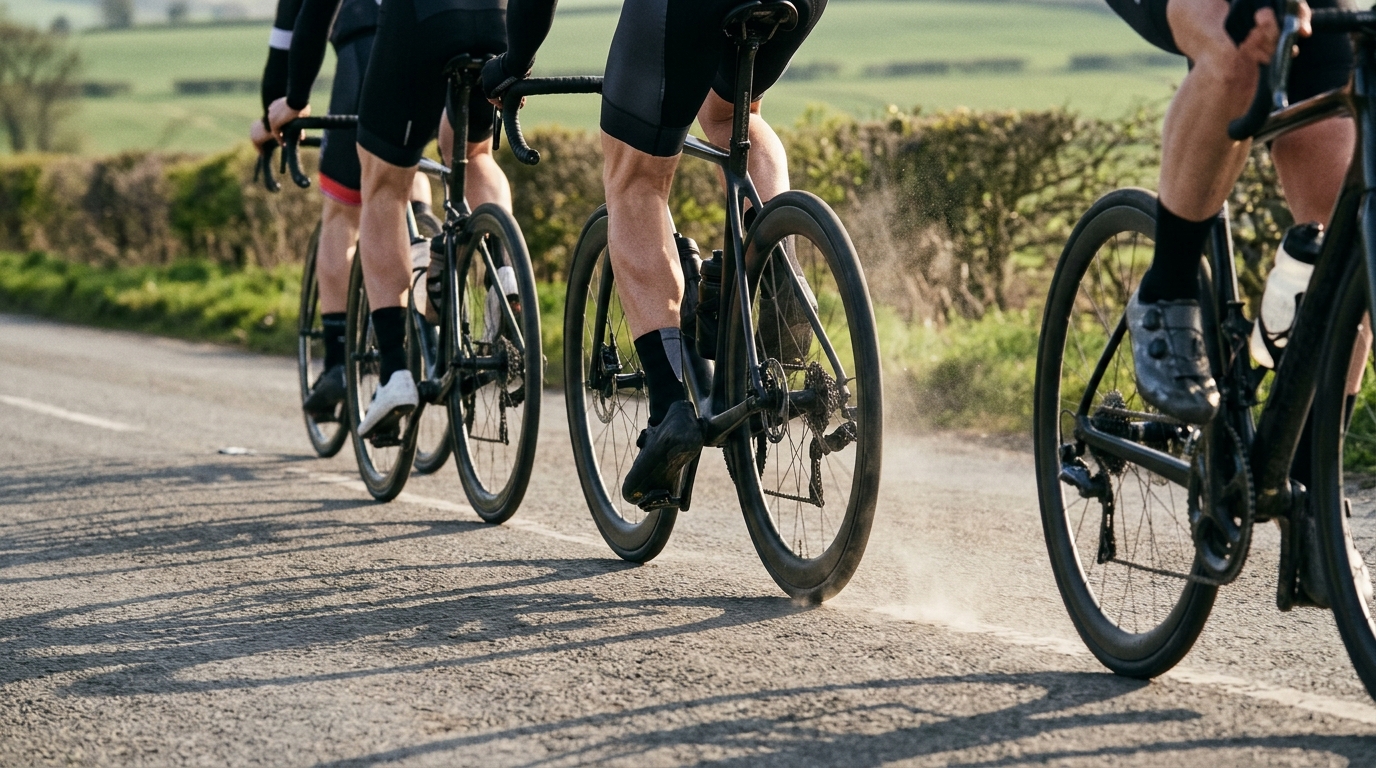
A rider sitting protected in a fast line can travel at the same speed as the rider on the front while producing meaningfully different power. The sheltered rider is not suddenly fitter. They are buying speed with position, not physiology.
That distinction matters if you use group ride speed to judge form. A fast average from a protected ride can overstate your fitness. A ride where you spent long periods in the wind can understate it. The same route, same speed and same normalized effort can mean very different things depending on how much time you spent pulling, floating mid-pack, closing gaps or coasting through congestion.
For data-driven endurance athletes, group ride power should not be treated like a solo time trial file. Drafting changes the cost of speed, so the analysis has to account for where you were in the group and what the air was doing.
What Data You Need: Power, Speed, Wind and Position Notes
A useful drafting analysis starts with enough context to explain why the power trace looks the way it does.
The essentials are straightforward:
- Reliable power data from a calibrated meter
- Speed data from GPS or a wheel sensor
- Wind direction and general conditions noted after the ride
- Position notes from key parts of the ride
- Route familiarity, especially where the road is exposed, sheltered, rising or technical
Power is the anchor because it tells you what the ride cost physiologically. Speed tells you what that power produced. Wind and position explain the gap between the two.
The most underrated input is the position note. After a group ride, write down where you sat during the decisive sections. Not a full diary, just enough structure to make the file readable after the fatigue has faded.
Use this repeatable template:
- Section: road name, segment name or clear route marker
- Wind direction: headwind, tailwind, crosswind or variable
- Group position: front, second wheel, mid-pack, tail, moving up or caught behind gaps
- Speed stability: steady, rolling, stop-start, technical or repeatedly slowing
- Power pattern: smooth, low and sheltered, repeated spikes, long pull, coasting and surging
- Confidence level: high, medium or low based on how clean the data and memory are
Without position context, you can still see the effects of drafting, but you will often misread them. A low-power section at high speed could be excellent shelter. It could also be a descent, a tailwind, a stop-start section or bad power data. The file rarely explains itself.
If your power meter setup is inconsistent, fix that before trying to estimate cycling energy savings. Drafting analysis is a comparison game, and poor measurement turns small differences into false conclusions. If you need a refresher on how power anchors training zones and pacing, start with the Neverchill FTP guide.
Create a Solo Baseline Before Comparing Group Efforts
You cannot estimate the drafting benefit until you know what similar speed costs when you are alone.
A solo baseline does not need to be a formal test. It needs to be repeatable and boring in the right way. Pick a route or set of segments you ride often, preferably with limited interruptions, predictable surface and minimal technical braking. Ride them solo at steady endurance, tempo and harder controlled efforts over time. The point is to learn your normal power-speed relationship when you are not protected by another rider.
This baseline becomes your reference point. If you normally need a certain power range to hold a given speed on an exposed stretch, and then you later hold that same speed in a group at lower power, the aerodynamic saving from sitting in starts to become visible.
Do not build your baseline from heroic days or messy files. A solo ride with shifting wind, repeated stops, soft tires, heavy clothing or questionable power data will distort the comparison. The baseline should represent ordinary conditions, not your best case or worst case.
The strongest approach is to compare similar conditions rather than chase precision. Same road direction, similar wind feel, similar bike setup, similar clothing, similar tire choice and similar effort style. You are not trying to prove a universal law. You are trying to understand your own cost of speed.
Estimate Watts Saved at the Same Speed
Once you have solo baseline data, you can start estimating watts saved at the same speed.
The cleanest method is segment-based. Choose a stretch where the group held a stable speed and where you know your position. Then compare it to solo efforts on the same stretch at a similar speed and in broadly similar conditions.
Ask a simple question: what power would this speed usually require when riding alone, and what power did it require while drafted?
That difference is your estimated saving. It will not be perfect, but it is actionable. If the group file shows you riding fast at a power well below your normal solo cost, you were receiving strong shelter. If the power is close to your solo cost, your draft was limited, the wind angle reduced the benefit, or you were repeatedly surging and braking in a way that erased the advantage.
A concrete mini-example: on your usual exposed segment, compare your solo power at a matching speed range against the group-file power from the same road direction, then log the difference as a confidence range. If the group ride had a cleaner line but more surges, note both. The comparison is useful because it is specific to that road, that wind direction and your position, not because it produces a universal saving.
Be careful with average power over long sections. Drafting is highly dynamic. A sheltered rider may spend time coasting, then spike power to close small gaps. The average may look moderate while the metabolic strain feels uneven. That is why the best analysis combines average power, variability, cadence, speed stability and the shape of the file.
A practical workflow:
- Mark the group section you want to analyze
- Note your position and wind exposure using the template
- Find a solo baseline effort at a similar speed on the same road
- Compare power required for that speed
- Check whether surges, braking, gradient or turns explain the difference
- Record the estimated saving as a range, not a fixed truth
Ranges are more honest than false precision. A group ride is not a wind tunnel. But a well-supported range is enough to guide pacing and tactics.
Spot Pulls, Shelter, Surges and Coasting in Ride Files
The power file tells a story if you know what to look for.
When you are pulling, speed often stays steady while power rises compared with the riders behind. If the road and wind are stable, the front rider is paying the full aerodynamic bill for the group. In your own file, pulls show up as sections where speed remains high and power sits above what you were producing while sheltered at similar speeds.
Shelter looks different. The speed stays high, but power drops below your solo baseline. Cadence may remain smooth if the group is steady. If the file shows high speed, low torque and minimal braking, you were likely sitting in clean draft.
Surges are the hidden cost of bad positioning. They appear as repeated spikes after small slowdowns, corners, rollers or gaps. A rider at the back of a group can sometimes see lower average power than the riders near the front, but the effort may be less efficient because it is full of accelerations. That matters for endurance athletes because repeated spikes can accumulate fatigue even when the headline average looks controlled.
Coasting also needs interpretation. A lot of zero-power time can mean useful conservation. It can also mean the group was inconsistent, congested or technically disrupted. Coasting into corners and then sprinting out of them is not the same as steady shelter in a smooth paceline.
Look for these patterns:
- Pulling: higher power at group speed, especially on exposed roads
- Sitting in: lower power at similar speed, smoother cadence, fewer accelerations
- Tail-gunning: low power between repeated spikes, often with braking before surges
- Crosswind exposure: power rises despite being near other riders
- Poor rotation: irregular pulls, mismatched speeds and unnecessary accelerations
The more your notes match the file, the more confidence you can place in the analysis.
Use Drafting Data for Pacing, Racing and Group Ride Decisions
Drafting analysis should change the next decision, not just explain the last ride.
In racing, drafting data helps you decide when to spend energy and when to hide. If your files show that sitting near the front gives you nearly the same shelter as sitting deep in the group, but with fewer accelerations, that is valuable. It means better positioning can reduce both aerodynamic cost and stochastic cost. You save energy not just by avoiding the wind, but by avoiding the accordion effect.
In group rides, the same logic helps you choose the right wheel. A strong rider who rides smoothly may save you more energy than a rider who lets gaps open and closes them violently. The best draft is not always the closest wheel. It is the wheel that gives you shelter without forcing repeated anaerobic corrections.
For pacing, your drafting estimate helps you avoid overconfidence. If you finish a fast group ride feeling strong because your average power was modest, ask how much of that was shelter. That does not invalidate the ride. It simply tells you not to convert that speed into a new solo pacing target.
The opposite also applies. If your power was high despite an ordinary speed, check whether you were exposed, pulling often, stuck in crosswinds or repeatedly closing gaps. The ride may have been more demanding than the speed suggests.
This is especially useful when planning events with changing group dynamics. If you expect to spend time sheltered, you can pace differently than you would solo. If you expect to pull, bridge or ride exposed, your solo baseline becomes more relevant. For estimating sustainable outputs before those decisions, the Neverchill FTP estimator can provide a starting point, but the ride file tells you how that power was actually spent.
Common Errors: Wind Shifts, Gradients, Stops and Bad Sensors
The most common mistake is treating every power-speed mismatch as drafting. It is not.
Wind can change the entire interpretation. A tailwind can make a solo effort look like a strong draft. A headwind can make a sheltered effort look underwhelming. A crosswind can reduce the value of sitting directly behind another rider and make position across the road more important than position in line.
Gradient also complicates the picture. On steeper or slower sections, aerodynamic drag becomes less dominant relative to the other forces you are overcoming. Drafting still may matter, but its effect on power-speed comparison is harder to isolate. If you compare a rolling group section with a flat solo baseline, you are likely mixing different problems.
Stops and slowdowns are another trap. A file with traffic interruptions can show low average speed and high normalized strain, or high speed with odd power gaps, depending on where the stops occurred. Remove messy sections before drawing conclusions.
Bad sensors can ruin the whole exercise. A drifting power meter, inconsistent tire pressure, speed dropouts or poor head-unit recording can create patterns that look tactical but are just measurement noise. If the file does not pass a basic credibility check, do not build conclusions from it.
Use this filter before trusting your estimate:
- Was the power meter reading normally before and after the section?
- Was speed recorded cleanly?
- Was the road direction similar to your baseline comparison?
- Did wind feel stable enough to compare?
- Were there stops, turns or braking events that distorted the effort?
- Do your position notes match the data pattern?
If the answer is uncertain, downgrade the confidence of the analysis rather than forcing a conclusion.
Turning Group Ride Data Into Better Riding
Good group ride power data should change how you ride.
If your analysis shows you save substantial energy in smooth shelter, prioritize positioning before panic in hard group rides. Move early, hold wheels cleanly, avoid the back when the road gets technical and choose riders who maintain speed rather than surge.
If your files show that you burn matches every time the group exits corners, the problem may not be fitness. It may be placement. Riding slightly closer to the front can reduce speed changes and make the entire ride cheaper, even if you spend a little more time in the wind.
If you discover that your pulls are much harder than your sheltered riding at the same speed, use that information deliberately. Pull when it serves the ride, the race or the training goal. Do not drift onto the front by accident and then wonder why the final section felt worse than the average power suggested.
The best cycling energy savings come from combining physiology with tactics. Power tells you what you spent. Speed tells you what you got. Drafting analysis explains why the exchange rate changed.
Stop asking only whether the group ride was fast. Ask how much that speed actually cost you, why it cost that amount, and what should change next time.