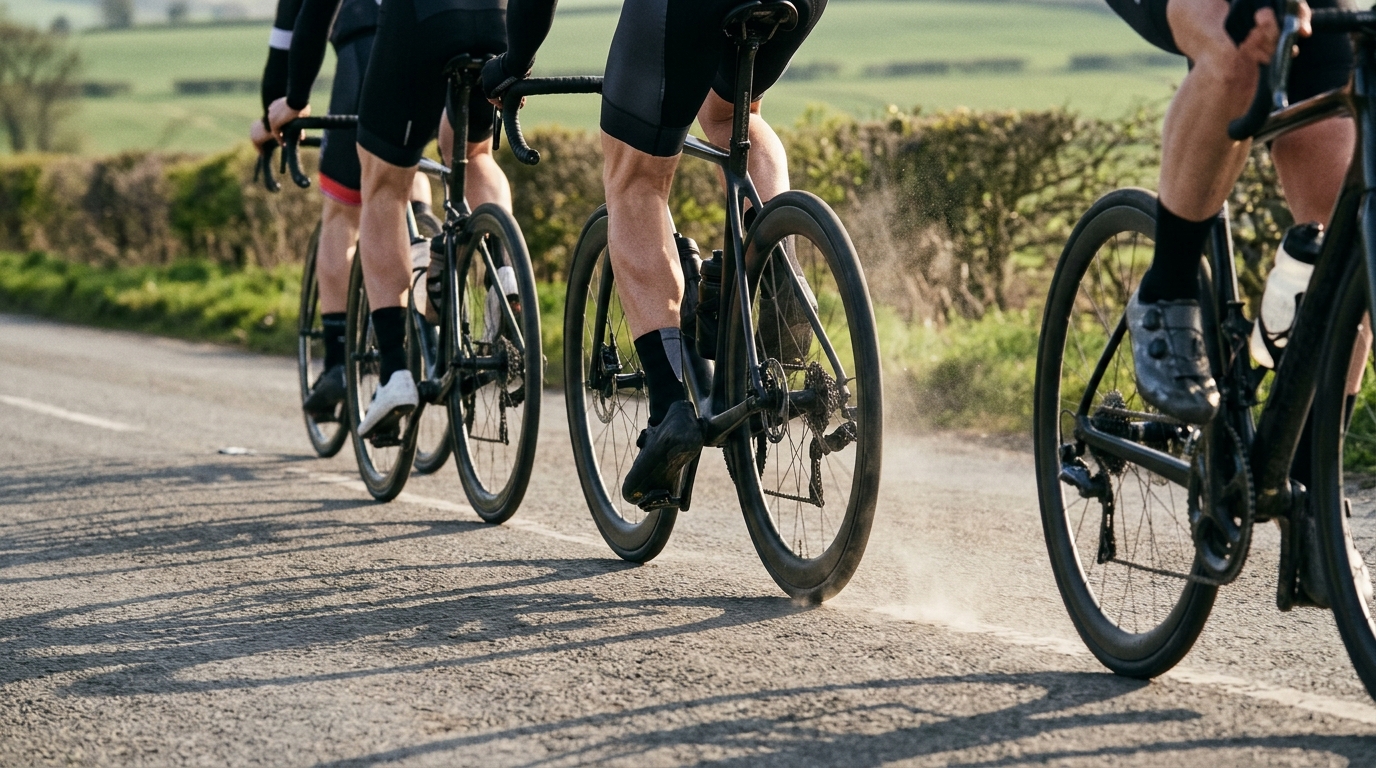
Image generated by our model.
cycling wind data
Cycling Wind Data: Separate Fitness From Weather
Speed is a noisy fitness signal when wind is involved. Use cycling wind data with power, direction and repeatable routes to judge rides more accurately.
Why Wind Makes Speed a Poor Fitness Signal
Speed feels like the cleanest output from a ride because it is easy to understand. You rode faster, so you assume you were fitter. You rode slower, so you assume something went wrong.
That logic breaks down quickly outside. Cycling speed is the product of power, aerodynamics, rolling resistance, road surface, position, terrain, drafting, braking, turns and weather. Wind sits near the top of that list because it changes the effective air speed your body and bike are pushing through.
That is why cycling wind data matters. A headwind can make a well-executed endurance ride look flat on average speed. A tailwind can make an ordinary day look like a breakthrough. If you judge fitness from speed alone, you risk judging the weather more than the rider.
The key is not to ignore speed. Speed is still the outcome that matters on the road. The goal is to stop treating it as a standalone fitness metric. Cycling power vs speed only becomes useful when you understand the conditions that connected them.
Power tells you what you produced. Speed tells you what the environment allowed that production to become.
What Wind Data Can Actually Tell You
Wind data is useful, but it is not perfect. Most riders pull wind from a weather source after the ride, then treat that reading as if it applied evenly to every road, corner, valley, hedge line and exposed section. Real rides are not that clean.
A weather source usually gives a broad-area estimate. Your ride happens in a local environment. Buildings, tree cover, terrain, traffic, group position and road direction all change the wind you actually experience. A weather source can show one direction while a sheltered lane gives you almost none of it.
So the best use of wind data is not to create a fantasy-perfect correction. It is to add context to the ride file.
Useful cycling wind analysis starts with a few practical questions:
- Was the wind direction broadly aligned with the hardest or fastest parts of the ride?
- Did the route include exposed roads where wind could have a clean effect?
- Were slow sections slow because of power loss, terrain, turns, traffic or air resistance?
- Did speed change when the road direction changed?
- Did perceived exertion match the power, or did it match the speed?
Wind data is most trustworthy when it explains a pattern that is already visible in the ride. If speed drops while power stays steady and the road turns into the wind, the interpretation is strong. If the file is full of stops, turns, group dynamics and terrain changes, wind is only one part of the story.
Data is strongest when multiple signals point in the same direction.
Cycling Power vs Speed: A Repeatable Review Workflow
The most useful way to interpret wind effect on cycling speed is to line up three signals: power, speed and direction.
Start with power. If you have a power meter, it is your anchor because it measures output rather than outcome. If power was stable and speed changed sharply on similar terrain, the environment likely changed. If speed dropped and power dropped with it, the ride was not just slower because of wind. You produced less.
Next, look at road direction. Wind only becomes meaningful when you know whether you were riding into it, with it or across it. A strong ride into a headwind can look slow. A soft ride with a tailwind can look fast. The file only makes sense once direction is part of the analysis.
Then compare speed against power on similar terrain. Do not blend climbs, descents, corners and city sections into one conclusion. Find steady portions where position, surface and traffic were reasonably consistent. That is where cycling wind data becomes useful.
Use this workflow after any ride where the speed feels misleading:
- Open the ride file and switch to a view that shows power, speed and route map together.
- Isolate one steady segment where terrain, position and traffic were reasonably consistent.
- Compare power and speed through that segment. Ask whether speed changed without a matching change in power.
- Check the road bearing on the map against the reported wind direction. Was the segment likely headwind, tailwind or crosswind exposed?
- Repeat the same check on a segment facing a different direction.
- Add a one-line training note, such as: 'Steady endurance power held well. Slow exposed roads matched headwind direction. No fitness concern.'
That final note matters. It turns a vague feeling into a reusable training record. A month later, you do not need to remember whether the day was windy, sheltered or chaotic. The context is attached to the file.
This is also where tools like functional threshold power and the FTP estimator can help frame the ride, but only if you keep the analysis honest. Threshold power can improve while average speed barely changes on windy days. The reverse can happen with a generous tailwind. Fitness work and environmental outcome are related, but they are not interchangeable.
Using Out-and-Back Segments to Spot Wind Effects
Out-and-back routes are the cleanest outdoor way to see wind influence because they expose the same rider, bike, road surface and elevation pattern to opposite directions. They are not perfect, but they reduce the number of variables.
When reviewing an out-and-back, do not stop at total average speed. Split the ride into outbound and return portions, then compare power and speed separately.
If power is similar both ways but speed is very different, wind is the obvious suspect. If the outbound leg feels controlled but looks slow, then the return leg feels easy and fast, the file is telling you conditions did a lot of work.
The more interesting case is when the slow leg was also the stronger leg. This happens often in training. A rider pushes steady power into a headwind, holds position well, stays calm and finishes with an average speed that looks unimpressive. Then the tailwind return inflates speed at lower relative strain. The headline speed flatters the easy half and undersells the productive half.
For performance tracking, save repeatable out-and-back segments that are long enough to settle into position and effort, but simple enough to analyze. Avoid sections with frequent stops or complicated turns. The cleaner the segment, the easier it is to separate fitness from weather.
How Crosswinds and Gusts Change Ride Interpretation
Headwind cycling data is relatively straightforward. A headwind slows you down and increases the cost of a given speed. A tailwind does the opposite. Crosswinds are more complicated because they affect handling, position and confidence as much as speed.
A crosswind can force a rider out of an efficient position. If you come off the extensions on a time trial bike, sit taller on exposed roads or tense up through gusty sections, speed can fall even if the wind is not directly in your face. The power file may look normal while the aerodynamic cost rises because your position degraded.
Gusts add another layer. Steady wind is easier to manage because the rider can settle into a rhythm. Gusts interrupt that rhythm. They create micro-surges, steering corrections, braking and sometimes a subtle reluctance to commit to speed. None of that shows up cleanly as a simple headwind or tailwind label.
This is why ride interpretation should include handling notes, not just numbers. If a session took place in gusty crosswinds and you were forced to ride conservatively, the speed may understate your physiological output. It may also mean the session was not ideal for testing fitness, even if it was useful for resilience and bike handling.
Crosswinds also matter in group rides. The same power can produce very different outcomes depending on shelter, echelon position and how well the group uses the road. If you spend time exposed while another rider sits protected, comparing speed without context misses the tactical reality.
Wind is not just a weather variable. It changes the structure of the ride.
When a Slow Ride Was Still a Strong Ride
A slow ride can be a strong ride when the internal load and execution were good, even if the external speed was poor.
Look for these signs:
- Power was aligned with the planned session.
- Effort felt appropriate for the target intensity.
- Cadence and position stayed stable under pressure.
- Speed losses matched exposed roads or headwind direction.
- You avoided unnecessary surges while holding the work.
- The ride did not collapse late despite adverse conditions.
That last point is important. Wind often exposes pacing discipline. A rider who chases normal speed into a headwind can turn an endurance ride into a much harder session without meaning to. The smarter rider lets speed fall, holds the correct power and keeps the workout intact.
The reverse is equally important. A fast ride is not automatically proof of improving form. If power was soft, perceived exertion was low and the route was helped by a tailwind on the fastest roads, the file may show a good speed outcome without a meaningful fitness signal.
Good analysis protects you from both errors.
How to Track Wind-Adjusted Progress Over Time
You do not need a perfect wind model to track progress better. You need repeatability and discipline.
Start by choosing a small set of benchmark routes or segments. They should be simple, familiar and relatively uninterrupted. Use them as comparison points, but only compare like with like. A calm day, a gusty day and a headwind day should not be judged as the same test.
For each benchmark effort, log a short note alongside the ride:
- Wind direction and general strength from your weather source.
- Whether the key section was sheltered or exposed.
- Whether the wind felt steady or gusty.
- Whether you held your normal position.
- Whether pacing matched the plan.
The value is not in building a lab-grade correction. It is in creating enough context that future analysis is honest.
When you review progress, look for patterns rather than isolated records. If power at a given effort is rising and speed is improving on similar routes in similar conditions, that is a strong sign of real progress. If speed improves only on wind-aided days, be cautious. If power improves while speed is flat across windy weeks, fitness may still be moving forward.
For athletes using structured training, session execution comes first and speed interpretation comes second. If the workout called for controlled endurance, tempo, threshold or repeatable high-intensity work, evaluate whether the physiology was delivered. Then use wind data to explain the speed outcome.
Cycling wind data should make you less reactive, not more obsessed. It should keep you from overvaluing tailwind speed and undervaluing headwind work.
Post-Ride Wind Review Checklist
Use this after rides where speed seems unusually fast or slow:
- Open the ride file and inspect power, speed and route direction together.
- Isolate one or two steady segments instead of judging the whole ride average.
- Compare power and speed on similar terrain.
- Check whether the road direction matched a likely headwind, tailwind or crosswind.
- Note whether the road was exposed or sheltered.
- Add handling context if gusts or crosswinds changed your position or confidence.
- Write one short ride note that explains whether speed reflected fitness, conditions or both.
Speed is still worth watching. But without wind context, it is a noisy signal. Pair it with power, direction, route knowledge and honest post-ride notes, and it becomes much more useful. That is how you separate fitness from weather without turning every ride into a lab test.