Imagem gerada pelo nosso modelo.
cardiac drift
Cycling Cardiac Drift: How to Measure and Use It
Use cycling cardiac drift to assess endurance durability, spot fatigue, and decide when to progress, hold, recover, or adjust for heat.
What Cardiac Drift Means for Cyclists
Cycling cardiac drift is the gradual rise in heart rate relative to power during sustained work. If you are holding roughly the same power but heart rate keeps climbing, the body is paying a higher internal cost for the same external output.
That distinction matters. Power tells you what you are doing to the pedals. Heart rate tells you how hard the body is working to produce it. Neither metric is complete on its own. A steady endurance ride at a familiar power can look controlled from the outside, but if heart rate steadily separates from that power, the file is pointing toward durability, heat load, fatigue, fueling, pacing, or aerobic conditioning.
This is where cardiac drift earns its place in a data-driven training system. It turns an ordinary endurance ride into a repeatable field check. It is not a lab test and it should not be treated like one, but it can show whether your aerobic system is becoming more stable at the workloads that actually matter in long events.
The discipline is interpretation. One high-drift ride does not automatically mean your base fitness is poor. It may mean the early pacing was too ambitious, the day was hotter than normal, the fueling was light, or the ride came after a hard block. The useful signal comes from repeated comparisons using the same method.
Why Power-to-Heart Rate Decoupling Matters
Power-to-heart rate decoupling is the practical expression of cardiac drift. You are asking a simple question: does the relationship between power and heart rate stay stable as the ride goes on?
When that relationship stays tight during a steady endurance session, it usually suggests the aerobic system is handling the workload well. The rider is producing repeatable power without a large rise in internal strain. That is the foundation of endurance durability: not just how hard you can ride fresh, but how efficiently you can keep producing work after hours on the pedals.
When the relationship opens up, the body is no longer producing the same output at the same cost. That can happen for several reasons. A rider progressing through an endurance block may see less decoupling at the same endurance power, which is a useful sign that the workload is becoming more economical. A rider seeing more decoupling than usual on a familiar session may be carrying fatigue, managing heat poorly, under-fueling, or riding just above the aerobic effort the body can currently support.
This is why cardiac drift can be more useful than FTP when the question is long-event durability. FTP helps set intensity, but it does not tell you how stable your physiology is deep into a ride. Two riders can have similar threshold power and very different outcomes after several hours. The rider who can keep heart rate controlled at steady aerobic power usually has more usable endurance late in hard group rides, fondos, gravel events, and long climbs.
How to Measure Cardiac Drift Manually
The cleanest drift check comes from a steady aerobic ride, not a chaotic file full of surges, coasting, stops, and climbs ridden at mixed intensity.
A good session should be boring by design:
- Ride at a controlled endurance effort.
- Keep power as steady as the terrain allows.
- Avoid repeated hard accelerations.
- Fuel and hydrate consistently.
- Use the same bike and power meter when possible.
- Choose a route with minimal interruptions.
- Start the analysis after the warm-up, not from the first pedal stroke.
Most training platforms can calculate decoupling automatically, but the manual method is simple enough to use without a black box.
A simple manual method
Take the main steady portion of the ride after the warm-up and split it into two equal halves.
For each half, calculate:
- Average heart rate divided by average power.
That gives you a heart-rate-to-power ratio for the first half and second half. Then compare the two:
- Drift = ((second-half ratio ÷ first-half ratio) - 1) x 100.
If the second-half ratio is higher, heart rate rose relative to power. That is drift.
The exact value is only comparable when you use the same method each time. If one file includes the warm-up, another removes descents, and another keeps stop-and-go traffic in the analysis, the number will look precise but mean less.
A worked example
These numbers are hypothetical, but the interpretation is the point.
Ride A is a steady endurance file:
- First half: 180 watts average power, 135 bpm average heart rate.
- Second half: 180 watts average power, 138 bpm average heart rate.
- First-half ratio: 0.75 bpm per watt.
- Second-half ratio: 0.77 bpm per watt.
- Drift: about 3 percent.
Ride B has nearly the same average power:
- First half: 181 watts average power, 136 bpm average heart rate.
- Second half: 179 watts average power, 150 bpm average heart rate.
- First-half ratio: 0.75 bpm per watt.
- Second-half ratio: 0.84 bpm per watt.
- Drift: about 12 percent.
On paper, both rides look similar if you only check average power. Physiologically, they are different rides. Ride A suggests the workload stayed controlled. Ride B suggests the same endurance power became much more expensive late in the session. The next question is why: heat, fatigue, fueling, pacing, or a workload that is currently too high for a clean endurance ride.
How to Set Up a Better Drift Check
Choose a repeatable session
Use an endurance ride that you can repeat often enough to build a baseline. It does not have to be the same road every time, but the ride type should be similar: steady pressure on the pedals, controlled pacing, and limited intensity above endurance.
Strip out noise
Exclude the warm-up, long descents, major stops, and obvious sensor errors. Heart rate responds slowly, so a file with constant surging can create misleading conclusions. Decoupling is most useful when the input is stable enough for the heart rate response to mean something.
Keep the comparison honest
Do not blend indoor rides in a cool room with hot outdoor rides and expect one clean fitness signal. Do not compare a fresh endurance day with a ride done at the end of a hard block and assume the difference is aerobic adaptation. Build separate baselines when the environment or fatigue state is clearly different.
Follow the pattern
One file gives you a clue. Repeated files give you evidence. If your normal endurance power produces a calmer heart-rate profile over time, that is meaningful. If drift rises across a block while perceived exertion also rises, the training load may be accumulating faster than recovery.
What Counts as Good, Bad, or Misleading Drift
There is no universal cutoff that works for every rider, climate, course, and training phase. The better question is how the ride compares with your own baseline using the same measurement approach.
Good drift is not necessarily no drift. Heart rate can move as body temperature, hydration status, glycogen availability, and fatigue change during prolonged work. A small, controlled rise can be normal.
Concerning drift is drift that is larger than your usual pattern for that ride type, especially when it comes with rising perceived exertion, fading power, poor recovery, or unusual breathing strain. If heart rate climbs while power slowly falls, that is a stronger warning sign than heart rate rising while power remains stable.
Misleading drift usually comes from bad inputs. Repeated climbs, stops, tailwind sections, caffeine changes, heat exposure, and hard pulls in a group can make the data look worse or better than the underlying physiology. This is where athletes often overreach. They see a decoupling number and turn it into a fitness diagnosis without checking how the ride was actually ridden.
A clean interpretation asks:
- Did power stay steady?
- Did perceived effort stay steady?
- Were conditions reasonably stable?
- Was fueling consistent?
- Was the rider rested or carrying fatigue?
- Was the file similar to prior comparisons?
If those answers are clean, the drift signal becomes much more trustworthy.
Common Causes: Heat, Fatigue, Fueling, and Pacing
Cardiac drift is not only a fitness metric. It is also a stress metric. That is why it is valuable and why it is easy to misread.
Heat
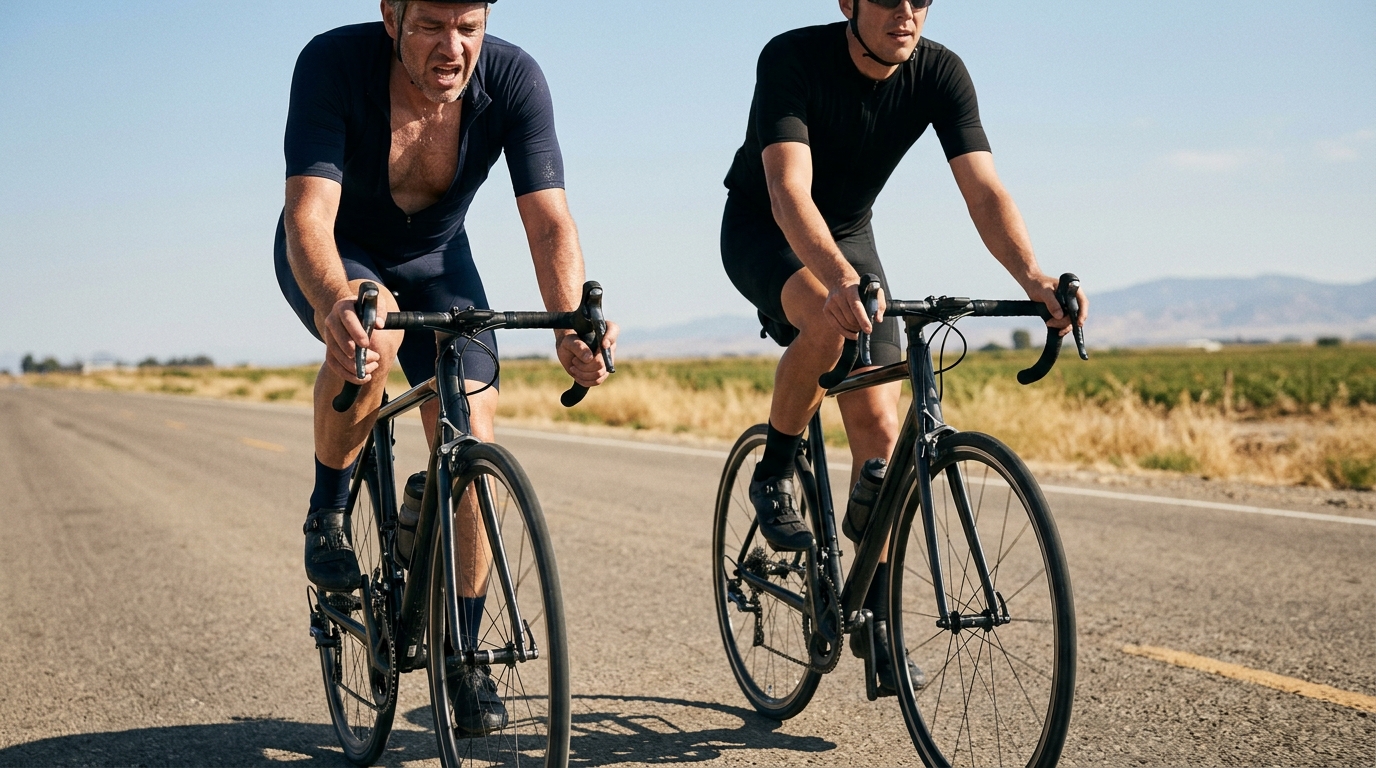
Heat is one of the biggest drivers of drift. As the body works to cool itself, cardiovascular demand rises. More blood is directed toward the skin, sweat loss changes fluid balance, and heart rate can climb even when power does not.
That does not make the file useless. It changes the question. Instead of asking whether fitness is worse, ask how well the workload was managed in the heat. For summer events, that may be the more relevant performance limiter.
The key is to separate the baseline. Compare hot rides with hot rides and cool rides with cool rides. Mixing them together makes the trend look more scientific than it is.
Fatigue
Training fatigue can increase drift because the body is less efficient at producing the same work when it is not recovered. If decoupling rises late in a block, especially alongside heavy legs and muted power, it may be a normal sign of accumulated load. If it persists after easier training, recovery is likely lagging.
This is where cardiac drift complements subjective notes. A rider may say an endurance ride felt fine, but the file may show the internal cost creeping up earlier than usual. That does not require panic. It does require attention.
Fueling
Under-fueling can create drift because the body has fewer readily available resources to maintain the workload. Heart rate may rise as the same power feels progressively harder. If drift shows up late in longer rides and improves when fueling becomes more consistent, the limiter was probably not pure aerobic fitness.
This distinction matters. Many cyclists respond to poor endurance files by adding more endurance volume. Sometimes the better fix is eating enough to support the endurance volume already being done.
Pacing
Poor pacing can manufacture cardiac drift. If the early part of the ride is too hard, even briefly, heart rate and metabolic strain can remain elevated later. The file then looks like an endurance problem when the real problem was intensity discipline.
For drift testing, the goal is not to prove you can ride high endurance power. The goal is to find the workload your aerobic system can support cleanly.
How to Use Drift to Guide Endurance Training
Cardiac drift is most valuable when it changes the next training decision.
Progress the duration
If drift is stable compared with your baseline and perceived exertion is also stable, progress the ride by adding duration before adding intensity. This is the cleanest signal that the current endurance workload is being absorbed.
The logic is simple: if the body can hold the same output without a rising internal cost, the next endurance adaptation is usually earned by extending the time over which that stability is required.
Hold the load or recover
If drift is rising and perceived exertion is rising, do not force progression. Hold duration steady, reduce the aerobic target for the next endurance ride, or take recovery if the pattern is appearing across multiple sessions.
This is the situation where more volume often looks disciplined but functions as noise. Endurance training works when the body absorbs repeated work. Rising drift plus rising RPE is a sign that absorption is becoming the limiter.
Separate heat from fitness
If drift is high only in hot conditions, do not treat it as a direct fitness regression. Build a heat baseline. Track how heart rate behaves in similar heat, with similar pacing and fueling, and judge progress inside that category.
This is especially important for athletes preparing for warm-weather events. The adaptation target is not only aerobic efficiency. It is the ability to manage thermal strain without letting the internal cost explode.
Fix fueling before blaming fitness
If drift appears late in longer rides and lines up with poor fueling, correct the intake pattern before rewriting the training plan. A rider who is under-fueled can look aerobically underdeveloped in the file while the real limiter is basic energy availability.
Lower the target when the workload is not sustainable
If drift is high on a normal day, pacing was steady, fueling was adequate, and the ride was not done under unusual fatigue, the endurance target may simply be too high for the purpose of the session. In that case, lower the power enough that heart rate stabilizes after the warm-up and stays more controlled late. Then build duration at that sustainable output.
That is not backing off from training. It is making the session specific. Endurance work should develop the ability to produce repeatable aerobic power, not turn every steady ride into a slow-motion threshold negotiation.
Why Group Rides Make Poor Drift Tests
Group rides can be excellent training and terrible physiology tests.
The file is usually too stochastic: coasting in the draft, sharp accelerations out of corners, hard pulls, soft-pedaling, surges over rises, and inconsistent airflow. Heart rate lags behind those changes, so the power-heart rate relationship becomes blurred. You can finish with a decoupling number, but the number is often describing the ride dynamics as much as your aerobic durability.
This matters because group rides often feel like the places where endurance is tested. They are, but not cleanly. Use them to evaluate performance under real-world variability. Use controlled endurance files to evaluate cardiac drift.
Mistakes to Avoid When Comparing Rides
Comparing different environments
Indoor and outdoor heart rate responses can differ because cooling, airflow, terrain, and motivation differ. Treat them as separate baselines unless conditions are tightly controlled.
Including the warm-up
Heart rate takes time to settle. Including the opening part of a ride can distort the first-half comparison and make drift look cleaner or messier than it really was.
Treating group rides as drift tests
Drafting, surging, coasting, and short hard efforts all distort the relationship between power and heart rate. The training may be valuable, but the drift analysis is rarely clean.
Ignoring sensor quality
A poor heart rate strap connection can ruin the analysis. So can inconsistent power data. Before interpreting physiology, make sure the tools are not creating the signal.
Chasing a perfect number
The goal is not to eliminate drift. The goal is to understand whether your aerobic system is becoming more stable at the workloads that matter to your riding.
The Bottom Line
Cycling cardiac drift is one of the better ways to connect external output with internal strain. Power shows the work. Heart rate shows the cost. The gap between them, tracked carefully, tells you whether endurance riding is becoming more durable or whether heat, fatigue, fueling, or pacing is distorting the session.
Use a consistent method: remove the warm-up, split the steady work into two halves, compare heart-rate-to-power ratios, and track the pattern over comparable rides. The number only has value when the process behind it is repeatable.
For endurance athletes, the real value is decision-making. Stable drift plus stable RPE means you can usually progress duration. Rising drift plus rising RPE means hold the load or recover. High drift in heat means build a separate heat baseline. Late drift with poor fueling means solve the fueling problem before blaming fitness.
Interpreted well, cardiac drift does more than describe what happened in a ride. It tells you what to do next.