Image generated by our model.
route planning
Cycling Route Time Estimate: Plan Ride Duration With Data
Build a better cycling route time estimate by modeling terrain, surface, wind, pacing, stops, and your own ride history.
Build the estimate from the ride you will actually do
A useful cycling route time estimate is not distance divided by a hopeful average speed. It is a model of how the route spends your energy and where it steals time.
The key shift is simple: estimate the ride in segments, then add the real-world friction that does not show up cleanly in moving speed. Terrain sets the power demand. Surface changes how much of that power becomes speed. Wind changes the cost of exposed roads. Stops and urban delays decide whether the ride fits the rest of the day.
That is why the best estimate is built from two outputs:
- Moving time: the expected time actually riding
- Elapsed time: the door-to-door duration including stops, delays, regrouping, and small interruptions
Most riders are decent at guessing moving time on familiar roads. The bigger miss is elapsed time, because it feels like admin rather than performance. In practice, elapsed time is the number that determines fueling, daylight, meet-up reliability, and whether the ride plan survives contact with real life.
Start with the inputs that change duration
Distance matters, but it is only the container. The real time cost comes from how that distance is distributed.
Distance
Distance sets the baseline. It does not explain the ride.
A steady route with few interruptions can be predictable even when it is long. A shorter route with repeated climbs, rough lanes, town crossings, and technical descending can take longer than the map suggests because every segment has a different limiter.
Use distance to size the ride, then break it apart.
Elevation gain
Elevation gain changes speed because climbing raises the power required to keep moving. It also changes pacing. A long steady climb rewards controlled effort. Repeated punchy climbs create surges that can look manageable early and become expensive late.
Separate climbing time from flat time. If the route has meaningful climbing, blending everything into one average speed hides the part of the ride most likely to distort the estimate.
Surface
Surface changes rolling resistance, confidence, and fatigue. Smooth pavement lets power translate cleanly into speed. Rough roads, gravel, broken lanes, and shared paths with poor sightlines all reduce efficiency.
The important point is not only mechanical drag. On rougher surfaces, the same power can produce less speed while costing more focus and stability. That fatigue shows up later, usually when the route asks for one more climb or one more exposed section.
Wind exposure
Wind matters most when the road is open and speeds are high enough for aerodynamic resistance to dominate. An exposed flat road into a headwind can ride like a climb even when the elevation profile looks harmless.
Do not try to predict the wind perfectly. Instead, label exposed sections as higher uncertainty and avoid giving them the same speed assumption as sheltered roads.
Use power or effort as the control variable
Speed is the outcome. Power and effort are the inputs you can control.
Start by defining the ride purpose. An endurance ride should be modeled from endurance effort, not from the pace you can hit while fresh. A hard group ride should account for surges and regrouping, not just the average power that appears afterward. A long solo route should be paced from what you can still ride smoothly late, after fueling, heat, traffic, and accumulated fatigue have started to matter.
If your training is anchored to functional threshold power, use that as the reference point. If the number is stale, the estimate bends in the wrong direction. An inflated FTP makes every segment look easier than it is. An underestimated FTP can make the route look unnecessarily risky. If needed, refresh the input with a recent test or a practical FTP estimate.
The pacing assumption should answer one question: what effort can you ride for this route without breaking the purpose of the session?
For endurance planning, that usually means a smooth effort you can fuel and repeat. For a performance route, it may mean a harder target on selected climbs and deliberately easier riding elsewhere. The estimate improves when the model reflects the actual strategy rather than an idealized version of the ride.
Estimate climbs, flats, descents, and delays separately
The biggest upgrade over a planner estimate is segment-level modeling. A route is not one speed problem. It is a sequence of different constraints.
| Segment type | Main limiter | Input to check | Conservative adjustment |
|---|---|---|---|
| Climbs | Sustainable power and pacing | Similar climb history, current fatigue, surface | Use a repeatable effort, especially for late climbs |
| Flat or rolling roads | Wind, position, traffic, variability | Exposed-road notes, group behavior, road surface | Slow exposed or surge-heavy sections |
| Descents | Skill, visibility, corners, surface | Familiarity, weather, traffic, technical difficulty | Do not assume climbing time is fully recovered |
| Urban or shared-path sections | Interruptions | Moving versus elapsed time from past rides | Add a delay buffer instead of hiding it in speed |
| Stops | Human behavior | Typical stop duration and frequency | Add explicit stop time to elapsed total |
Climbs
For climbs, use your expected power or effort, then anchor the time to past rides on similar climbs. Similar does not need to mean identical. It should mean close enough in rhythm, surface, steepness pattern, and placement in the ride that the comparison is useful.
Do not model every climb as a best effort. If there are multiple climbs, the first one should not be paced like the only one. If the hardest climb comes late, the estimate should reflect what you can still produce after the earlier work.
A good climbing estimate asks:
- Is the climb steady or variable?
- Can you stay seated and controlled, or will it force repeated accelerations?
- Is the surface fast enough to support consistent power?
- Does it come before or after the route has already created fatigue?
The same elevation gain can produce very different time costs depending on rhythm and placement.
Flats and rolling terrain
Flat roads look predictable on a map, but they are highly sensitive to wind, road exposure, surface, traffic, and position on the bike.
For solo rides, base flat speed on an effort you can hold without quietly drifting into fatigue debt. For group rides, separate sheltered time from time spent pulling or responding to accelerations. A smooth group can raise speed without raising perceived cost. A messy group can do the opposite through braking, surging, and poor rotation.
Rolling terrain needs special attention because it rewards bad pacing. If every rise becomes a threshold effort, the file may still look controlled by average power while the legs carry the cost. Build in the cost of variability when the route has frequent turns, blind rises, or uneven pacing demands.
Descents
Descents are not free time. They are lower-power sections, but speed depends on road quality, visibility, corners, traffic, weather, and skill.
A wide familiar descent can be fast and predictable. A narrow unknown descent can be slow even if the profile suggests a quick payoff. Power cannot solve a technical speed ceiling. If the descent is unfamiliar, wet, busy, or rough, estimate it conservatively.
Turn ride history into better future estimates
Your best planning data is already in your ride files, but only if you pull the right parts from them.
Do not just look at route average speed. Extract the pieces that match the next ride:
- Moving speed on similar climbs: compare climbs with similar rhythm, surface, and placement in the ride. Use late-ride climbs separately from early climbs if your pace fades.
- Moving speed on similar flat or rolling roads: separate sheltered roads from exposed roads, and smooth pavement from rougher surfaces.
- Typical elapsed-time loss on urban exits: compare elapsed time with moving time from door to open road. This is where signals, junctions, shared paths, and navigation checks usually hide.
- Average stop duration: pull normal durations for coffee stops, bottle refills, clothing changes, photo pauses, and regrouping. Use your real behavior, not your planned behavior.
- Exposed-road slowdown notes: tag rides where headwind, crosswind, or open roads made a section slower than expected. Those notes are more useful than a clean file with no context.
- Late-ride fade patterns: check whether power, cadence, or speed typically drops in the final part of long rides, especially after repeated climbs or underfueling.
This is where the model becomes personal. A generic planner can estimate the geometry of a route. Your history estimates how you ride that geometry when the road gets rough, the group gets messy, or the final climb arrives with tired legs.
A practical workflow for estimating ride duration
Use this sequence before a meaningful route, long ride, group start, or daylight-sensitive session.
Step 1: Split the route into segments
Divide the route into logical chunks:
- Urban exit or approach roads
- Main climbs
- Flat or rolling sections
- Exposed roads
- Rough or technical surface sections
- Descents
- Known stop points
The segments do not need to be perfect. They need to isolate the things that change speed.
Step 2: Add distance and elevation gain for each segment
For each segment, note the distance and elevation gain from your route planner. This gives the segment its basic shape.
A short climb with meaningful gain needs a different assumption than a long flat road. A rolling section with small repeated rises needs a different assumption than a straight sheltered valley road.
Step 3: Assign expected power or effort
Set the effort you actually intend to ride:
- Endurance effort for aerobic rides
- Controlled tempo for purposeful steady sections
- Harder effort only where the ride plan calls for it
- Easier effort after hard segments, before technical descents, or late in the route
This is the step that prevents the model from becoming a fantasy. If you would not ride that effort in the real session, do not use it to make the estimate look faster.
Step 4: Adjust for surface and wind exposure
Mark each segment as fast, neutral, or slow relative to your normal conditions.
Use surface notes for rough roads, gravel, broken pavement, or shared paths. Use exposure notes for open roads, likely headwind sections, or places where crosswinds make position and handling less efficient.
The adjustment does not need to be mathematically elegant. It needs to be honest. If similar exposed roads usually cost you time, slow that segment before the ride instead of explaining it afterward.
Step 5: Add stop and delay buffers
Keep buffers explicit. Do not hide them inside a lower route-wide speed.
Add separate time for:
- Urban exits and entries
- Traffic signals and junctions
- Planned food or water stops
- Regrouping
- Clothing changes
- Navigation checks
- Mechanical risk on remote or rough routes
This produces two useful numbers: moving time and elapsed time. The second one is the one that protects the rest of the day.
Worked example using hypothetical numbers
The numbers below are hypothetical planning inputs for one rider. They are not performance standards and should not be treated as universal data.
A rider is planning a route with these segment estimates:
- Urban exit: 8 km, 60 m elevation gain, easy effort. Past rides on this exit usually show 24 minutes moving time and 8 minutes of elapsed-time loss from signals and junctions.
- Main climb: 10 km, 500 m elevation gain, controlled endurance to tempo effort around 210 W for this hypothetical rider. Similar climbs usually take 55 minutes, but the planned road surface is rough, so the rider adds a 5-minute surface adjustment.
- Exposed rolling section: 32 km, 250 m elevation gain, endurance effort around 180 to 190 W. Similar sheltered roads take about 80 minutes, but the section is open to wind, so the rider plans 90 minutes.
- Descent and return roads: 20 km, 90 m elevation gain, low to moderate effort. Because the descent is unfamiliar and technical, the rider estimates 45 minutes rather than assuming the downhill will fully repay the climbing time.
- Planned refill and clothing stop: 12 minutes.
- Extra navigation and regrouping buffer: 5 minutes.
The moving-time estimate is:
- Urban exit: 24 minutes
- Main climb with rough-surface adjustment: 60 minutes
- Exposed rolling section with wind adjustment: 90 minutes
- Descent and return: 45 minutes
- Total moving time: 219 minutes, or 3 hours 39 minutes
The elapsed-time estimate adds the non-moving costs:
- Urban delay buffer: 8 minutes
- Planned stop: 12 minutes
- Navigation and regrouping buffer: 5 minutes
- Total buffer: 25 minutes
- Total elapsed time: 244 minutes, or 4 hours 4 minutes
The important part is not the exact arithmetic. It is the structure. The rider has modeled distance, elevation gain, intended effort, surface, wind exposure, stops, and elapsed time separately. If the ride finishes late, the post-ride review can identify the segment that broke the estimate instead of blaming the whole route.
Use the estimate to plan fueling, daylight, and meet-ups
Once the estimate is realistic, it becomes more than a scheduling tool.
Fueling should follow expected duration and intensity, not just distance. A hilly endurance route may need earlier intake than a flatter route if the climbs create sustained pressure. A group ride with repeated hard pulls can demand more attention to fueling than its average power suggests.
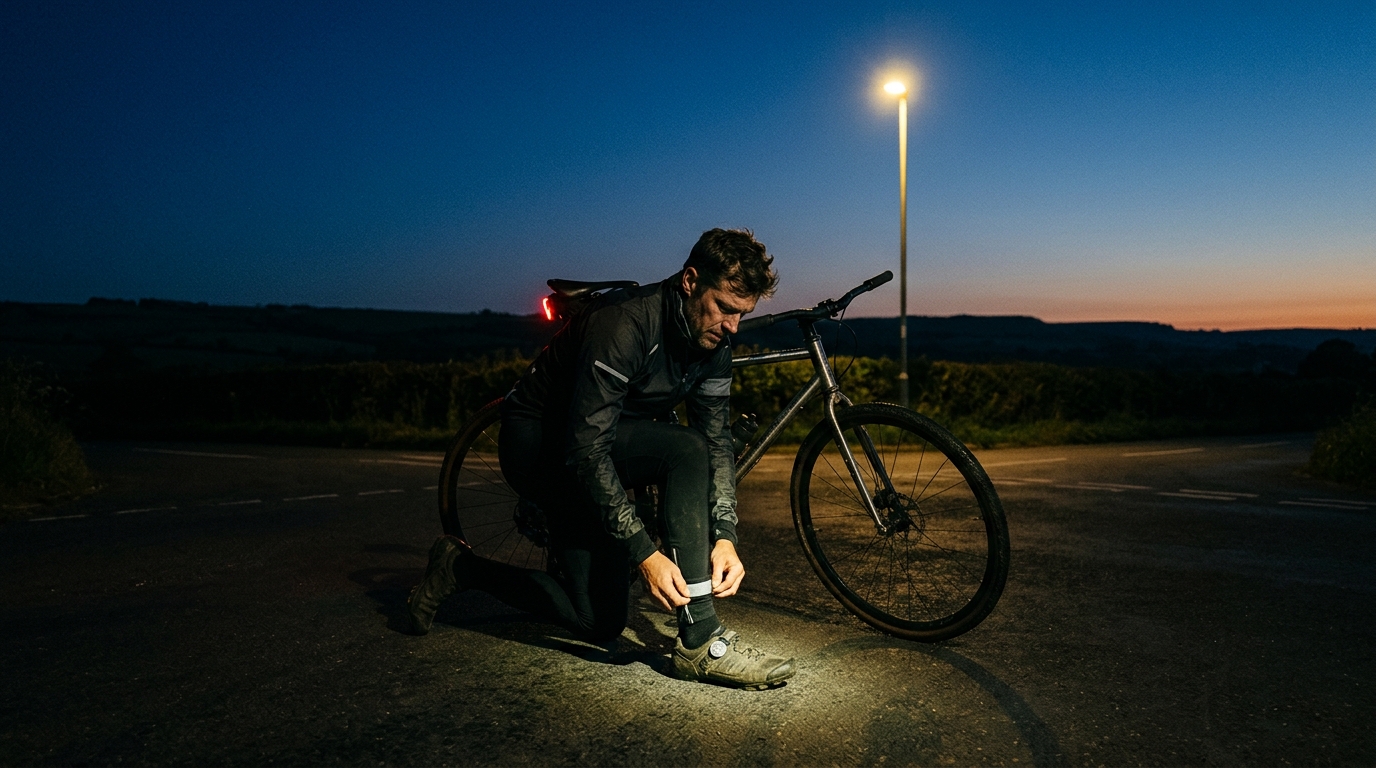
Daylight planning should be based on elapsed time. A route that looks safe on moving time can become marginal once stops, traffic, navigation, and fading pace are included. If the finish approaches low light, the estimate should influence lights, clothing, route choice, and start time.
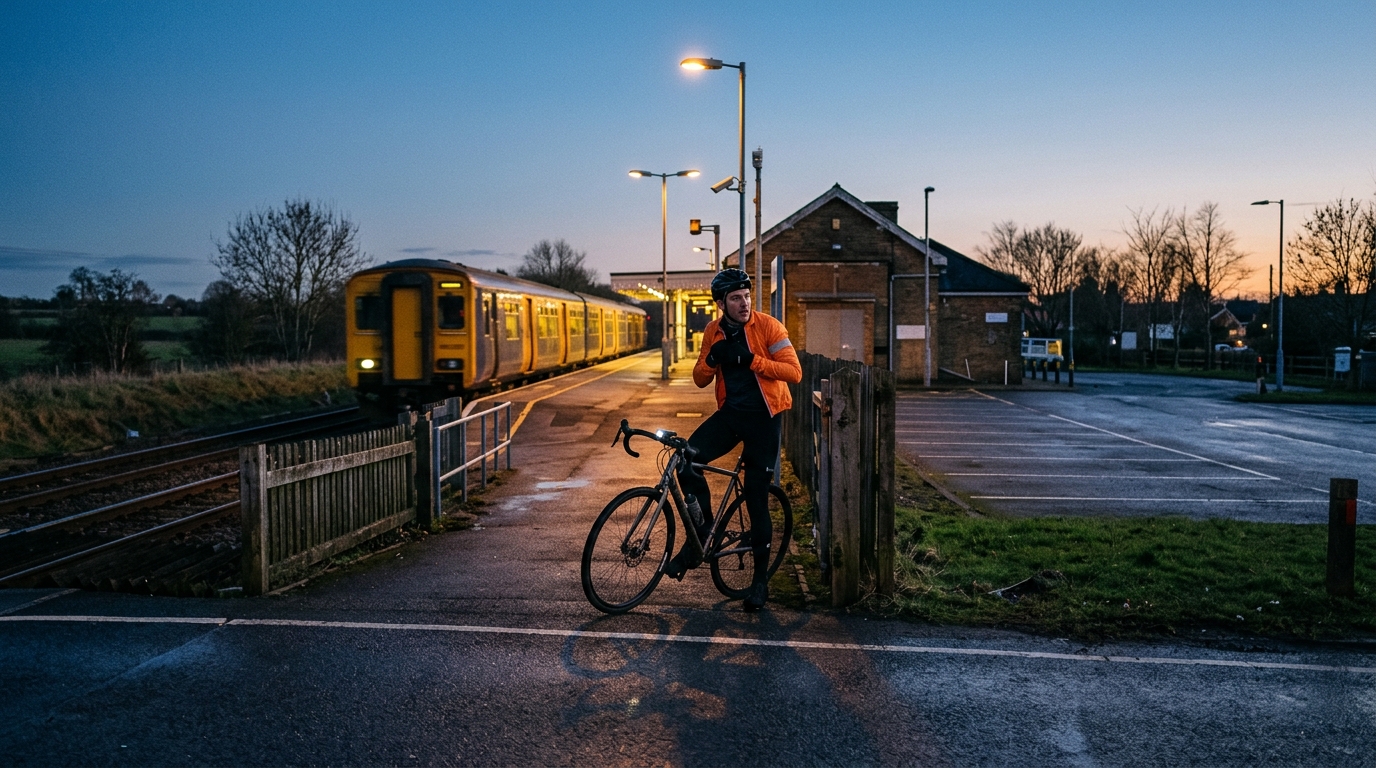
Meet-up timing needs the same discipline. If you are riding to a group start, do not estimate the transfer like a clean workout interval. Build in signals, clothing adjustments, bottle filling, and the small delays that always seem to appear when the rollout time is fixed.
A good estimate tells you whether to carry more food, choose faster tires, start earlier, shorten the route, change the pacing target, or skip the extra loop. That is the value of modeling. It makes the trade-offs visible before the ride starts.
Validate the estimate after the ride
The first version will be imperfect. That is fine. The goal is not perfect prediction on the first attempt. The goal is a model that improves every time you compare it with reality.
After the ride, review the gap between estimated and actual time by segment:
- Were climbs slower because the effort target was too ambitious?
- Were flats slower because of wind, surface, traffic, or fatigue?
- Were descents limited by technical difficulty or caution?
- Did the urban exit cost more elapsed time than usual?
- Did stops run longer than planned?
- Did the group ride smoother or messier than expected?
- Did fueling affect late-ride power and speed?
Then update the model. If exposed roads keep running slow, adjust them before the next route. If late climbs consistently fade, lower the power assumption or fuel earlier. If coffee stops are never short, stop pretending they are.
The strongest estimate is segment-level and elapsed-time aware
The most useful cycling route time estimate is not the one with the cleanest average speed. It is the one that separates the ride into the problems that actually determine duration: climbing, rolling terrain, surface, exposure, descending, traffic, stops, and fatigue.
Segment-level pacing is the biggest upgrade over a generic planner because it gives each part of the route the constraint it deserves. But elapsed time is the metric most riders under-model. Moving time tells you how long the workout might last. Elapsed time tells you whether the plan works in the real world.
If you want the estimate to be actionable, build it from your own ride history, assign realistic effort by segment, adjust for surface and wind, then add stops and delays explicitly. That model will not be perfect, but it will be useful in the way a single average speed rarely is: it will show you where the ride is likely to go right, where it is likely to slip, and what to change before it does.